| 일 | 월 | 화 | 수 | 목 | 금 | 토 |
|---|---|---|---|---|---|---|
| 1 | 2 | 3 | ||||
| 4 | 5 | 6 | 7 | 8 | 9 | 10 |
| 11 | 12 | 13 | 14 | 15 | 16 | 17 |
| 18 | 19 | 20 | 21 | 22 | 23 | 24 |
| 25 | 26 | 27 | 28 | 29 | 30 | 31 |
- Matplotlib
- docker
- GCP
- 완전탐색
- PytorchLightning
- 프로그래머스
- NaverAItech
- pep8
- rnn
- wandb
- datascience
- Kubernetes
- autoencoder
- FastAPI
- GitHub Action
- pytorch
- vscode
- NLP
- 알고리즘
- 코딩테스트
- 네이버AItech
- Kaggle
- leetcode
- DeepLearning
- 백준
- torchserve
- GIT
- FDS
- python
- github
- Today
- Total
Sangmun
[Data Viz] Customizing Matplotlib 본문
1. mpl.rc
https://matplotlib.org/stable/tutorials/introductory/customizing.html
mlp.rc로 line의 style을 바꾸어 본다면 아래와 같은 2가지 방법이 있다.
import matplotlib.pyplot as plt

# 1번째 방법
plt.rcParams['lines.linewidth'] = 2
plt.rcParams['lines.linestyle'] = ':'

# 2번째 방법
plt.rc('lines', linewidth=2, linestyle=':')
2. theme
matplotlib 에서 기본적으로 사용가능한 theme는 아래와 같으며
print(mpl.style.available)

# output
['Solarize_Light2', '_classic_test_patch', 'bmh', 'classic',
'dark_background', 'fast', 'fivethirtyeight', 'ggplot', 'grayscale',
'seaborn', 'seaborn-bright', 'seaborn-colorblind', 'seaborn-dark',
'seaborn-dark-palette', 'seaborn-darkgrid', 'seaborn-deep', 'seaborn-muted',
'seaborn-notebook', 'seaborn-paper', 'seaborn-pastel', 'seaborn-poster',
'seaborn-talk', 'seaborn-ticks', 'seaborn-white', 'seaborn-whitegrid',
'tableau-colorblind10']
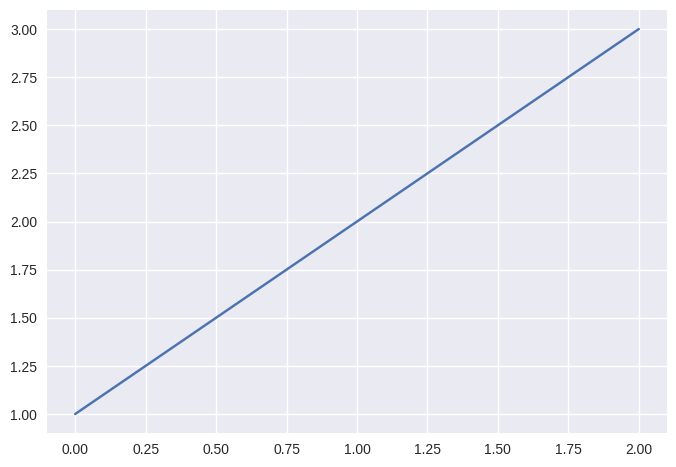
seaborn style로 바꾸고 싶으면 아래와 같이 적용을 하면 된다.
mpl.style.use('seaborn')
# mpl.style.use('./CUSTOM.mplstyle') # 커스텀을 사용하고 싶다면

plt.plot([1, 2, 3])
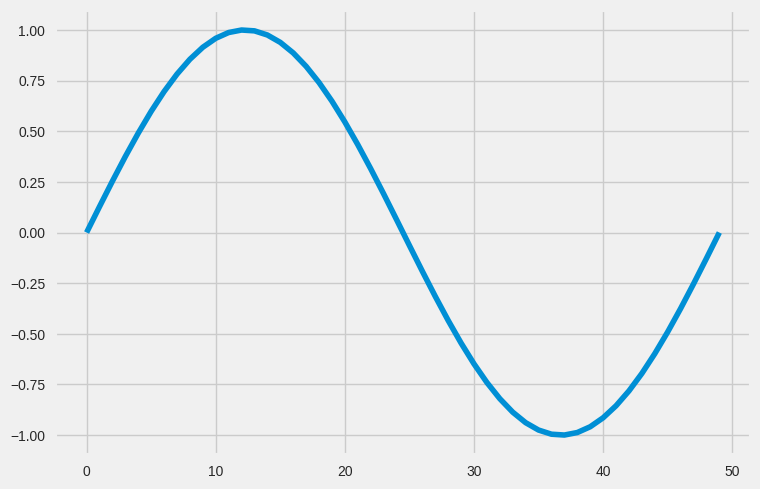
전체적인 style 세팅은 그래도 두고 일시적으로 style을 변경하고 싶으면 with을 사용하면 된다.
with plt.style.context('fivethirtyeight'):
    plt.plot(np.sin(np.linspace(0, 2 * np.pi)))
plt.show()
3. cyberpunk theme
cyberpunk theme는 개인적으로 좋아하는 테마라 내용을 추가해보았다.
직접 제작 소스 코드 : https://matplotlib.org/matplotblog/posts/matplotlib-cyberpunk-style/
깃허브 : https://github.com/dhaitz/mplcyberpunk
GitHub - dhaitz/mplcyberpunk: "Cyberpunk style" for matplotlib plots
"Cyberpunk style" for matplotlib plots. Contribute to dhaitz/mplcyberpunk development by creating an account on GitHub.
github.com
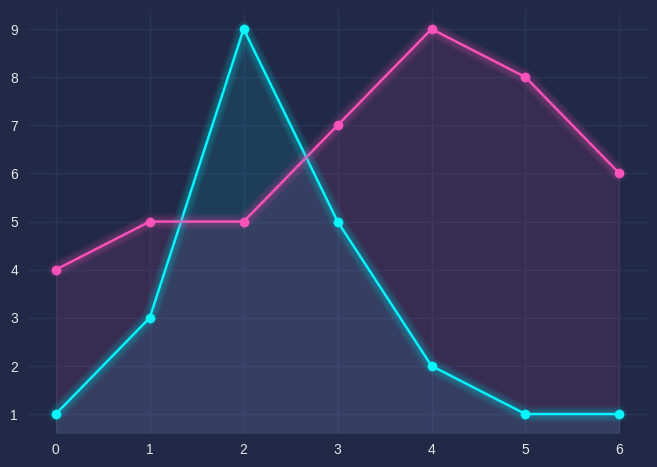
다른 테마들과는 다르게 pip을 이용하여 설치를 해주어야 다른 테마처럼 사용이 가능하다.
import matplotlib.pyplot as plt
import mplcyberpunk

plt.style.use("cyberpunk")

plt.plot([1, 3, 9, 5, 2, 1, 1], marker='o')
plt.plot([4, 5, 5, 7, 9, 8, 6], marker='o')

mplcyberpunk.add_glow_effects()

plt.show()
출처 : NaverAItech, 안수빈 마스터
